Scanning Electron Microscopy
Scanning Electron Microscopy (SEM) is an imaging technique that provides higher magnification than is possible using reflected light, which is the optical microscopy method most familiar to everyone. By beaming a stream of tightly focused electrons at a surface, and precisely detecting signals emanating from that surface, a high-resolution topological model of the surface can be developed. A computer renders the surface details in such a way as to make them appear as a black and white photograph of the surface, but at magnifications which can be over one hundred thousand times their actual size.
Flotation concentrate arising from the ongoing bench-scale optimization trials being conducted by SGS Canada (Lakefield) were submitted “as received” to Evans Analytical Group, for imaging by means of Scanning Electron Microscopy. The “as received” designation indicates that the concentrate was not subject to any purification techniques subsequent to the multi-stage froth flotation concentration at SGS. The graphite concentrate was classified by particle size, and assayed for total carbon by SGS, by Leco furnace with IR detection
+ 65/ -48 mesh mesh (>210/ <300 microns) - 123.2 g @ 99.5% C(t);
+48/-32 mesh (>297/<500 microns) - 118.8 g @ 99.6% C(t); and,
+32 mesh (>500 microns) - 31.7 g @ 100% C(t).C11
The SEM images reported here are of the +65/-48 mesh fraction.
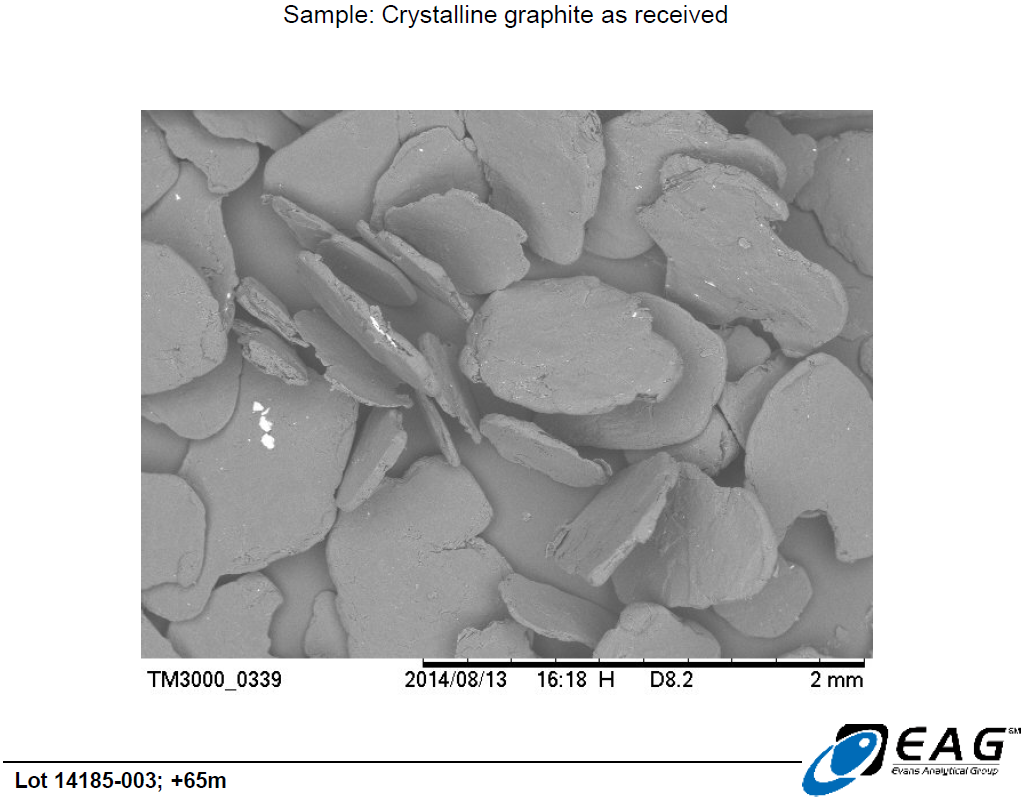
Large, platy, highly organized graphite crystals, with minor hydrothermal matrix adherent to faces and edges. (50 X magnification)
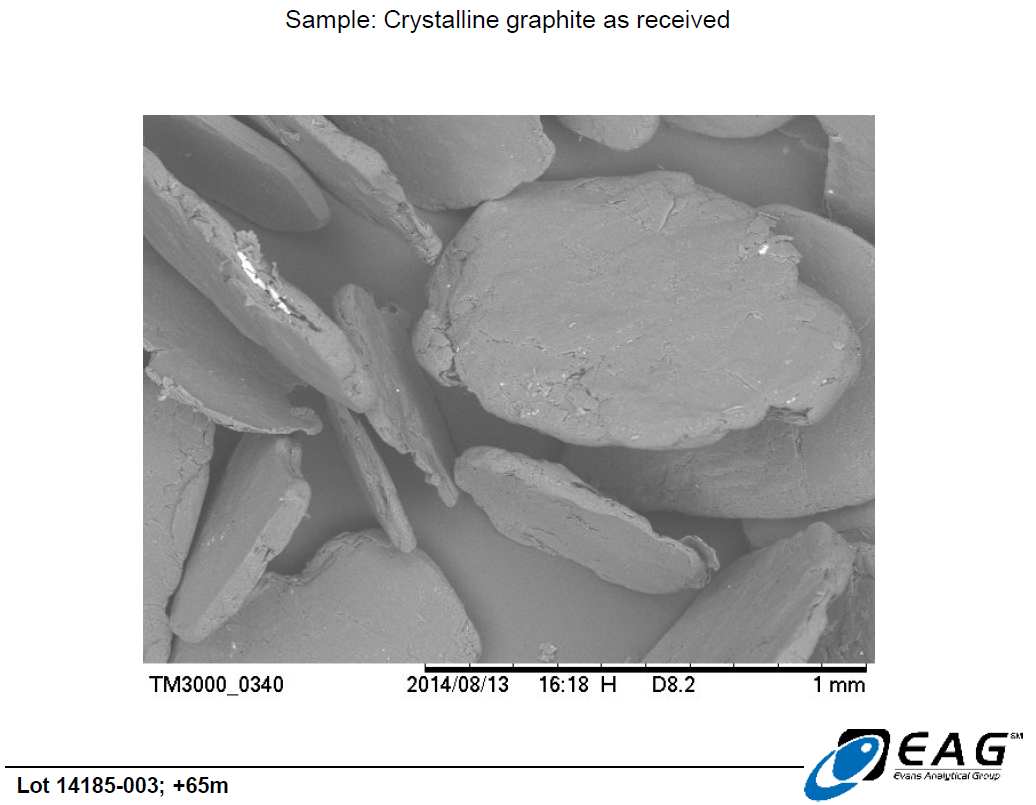
Magnified view (110 X), showing edge-intercalated hydrothermal matrix material.
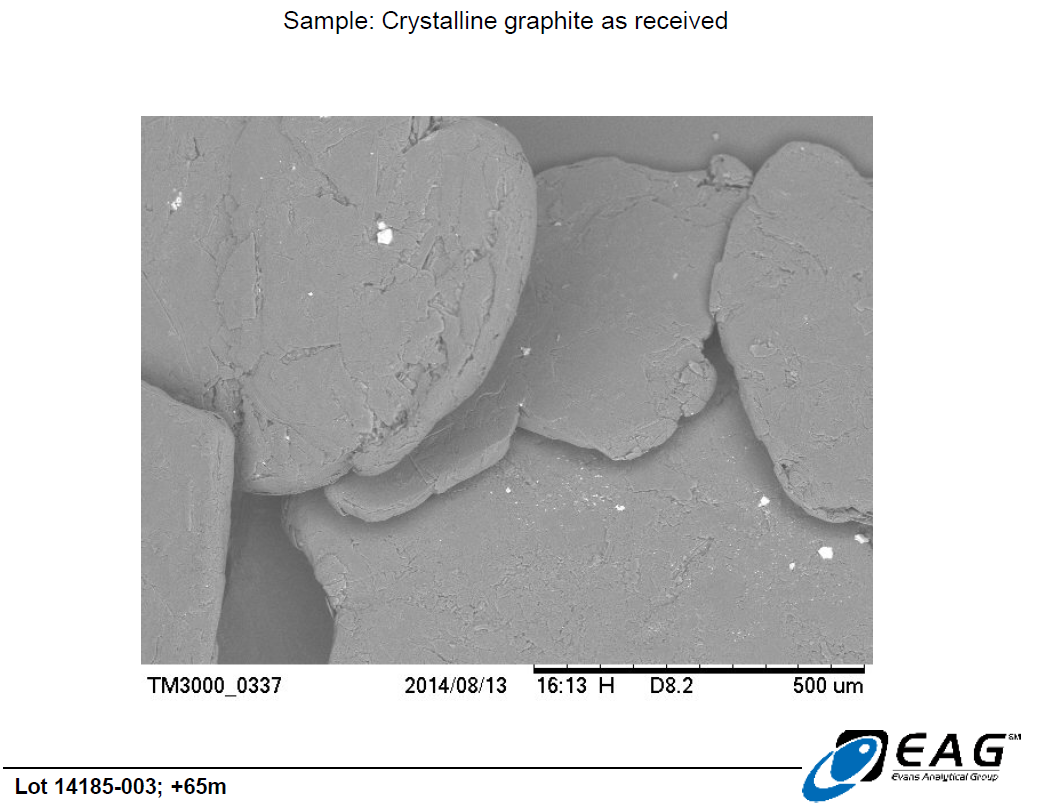
Magnified view (165 X) of minor hydrothermal matrix crystals adherent to the face of the graphite crystals.
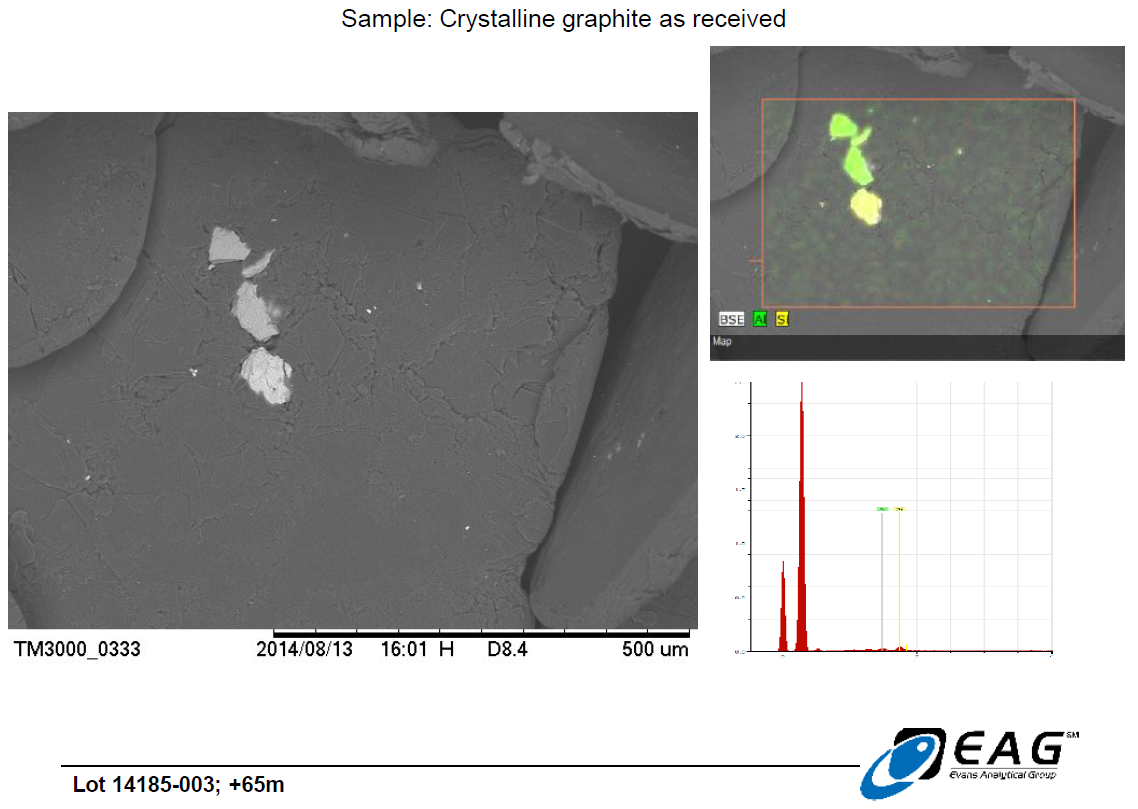
Detailed view of hydrothermal matrix particles on graphite surface, with limited elemental analysis available from back-scattered electrons (BSE analysis), confirming the siliceous nature of the matrix. (206 X magnification)
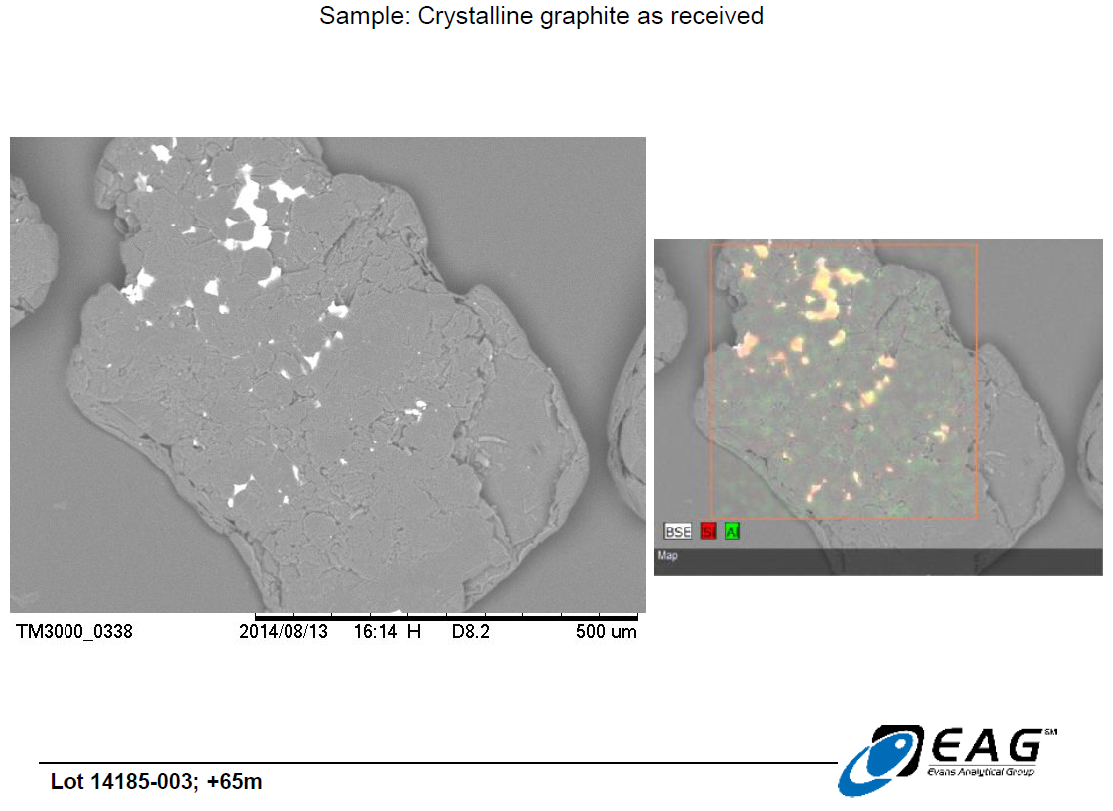
Graphite crystal with more extensive hydrothermal matrix carry-over, with similar siliceous composition. (192 X magnification)
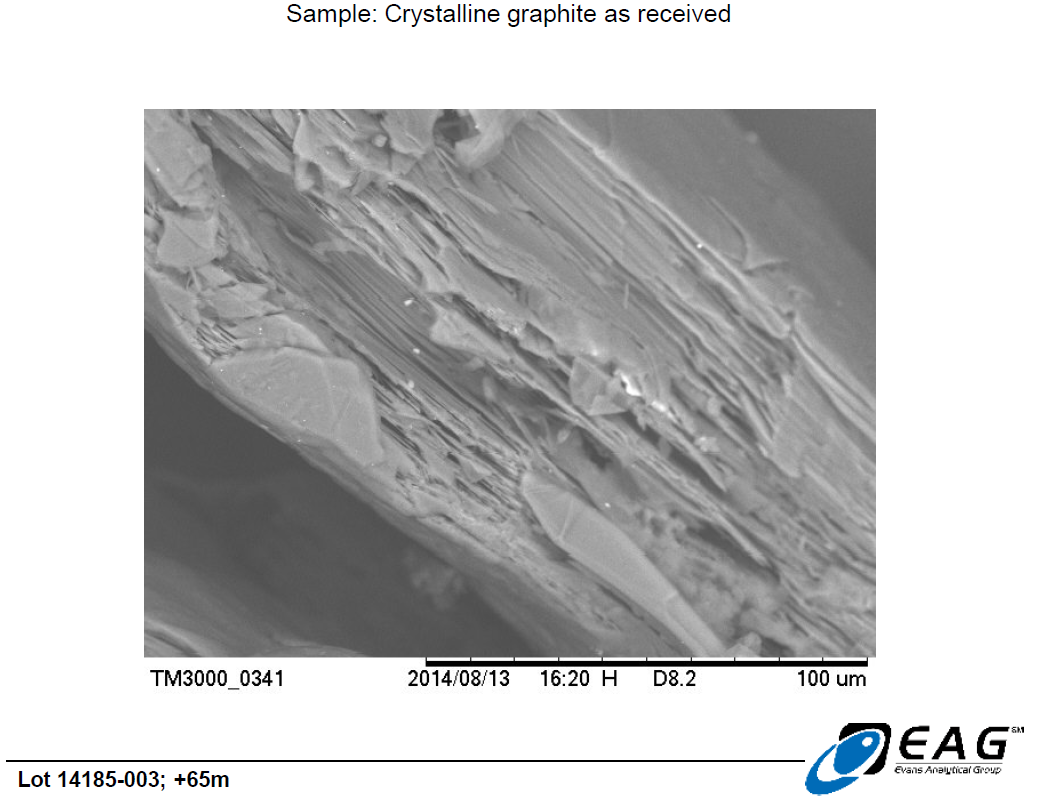
Magnified view (1100 X) of graphite crystal edge domain, with minor matrix intercalation, and superficial mechanical disruption of the crystalline structure.
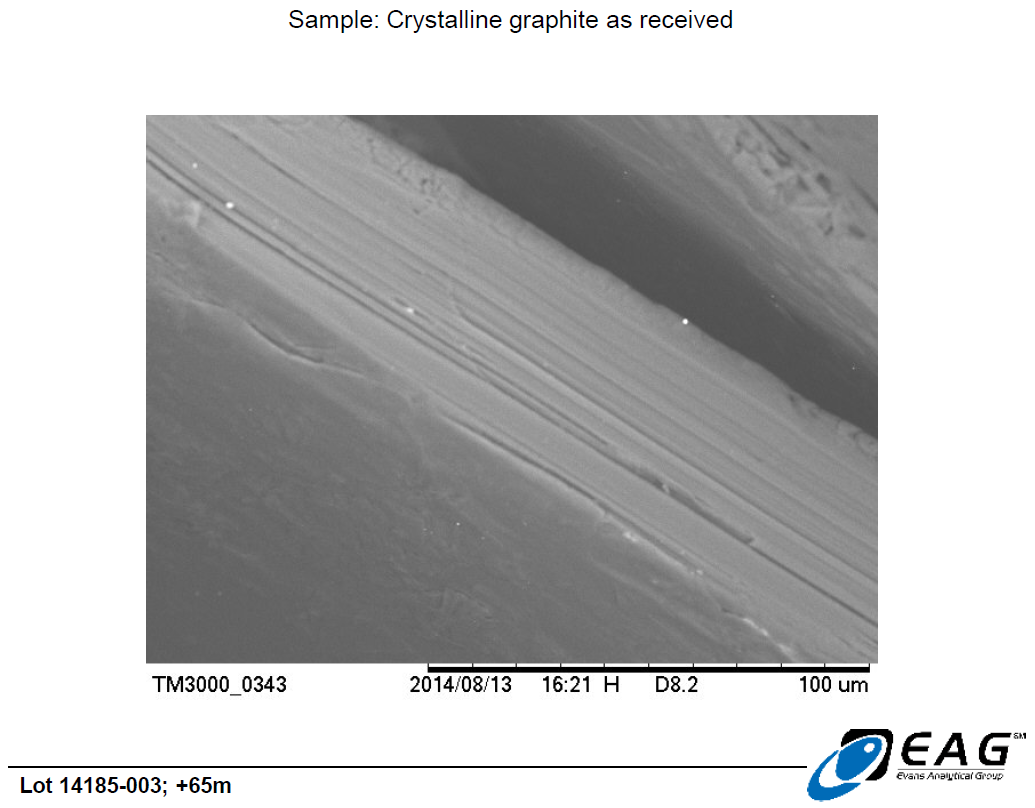
Magnified view (1100 X) of highly crystalline edge domain, with minor matrix intercalation.
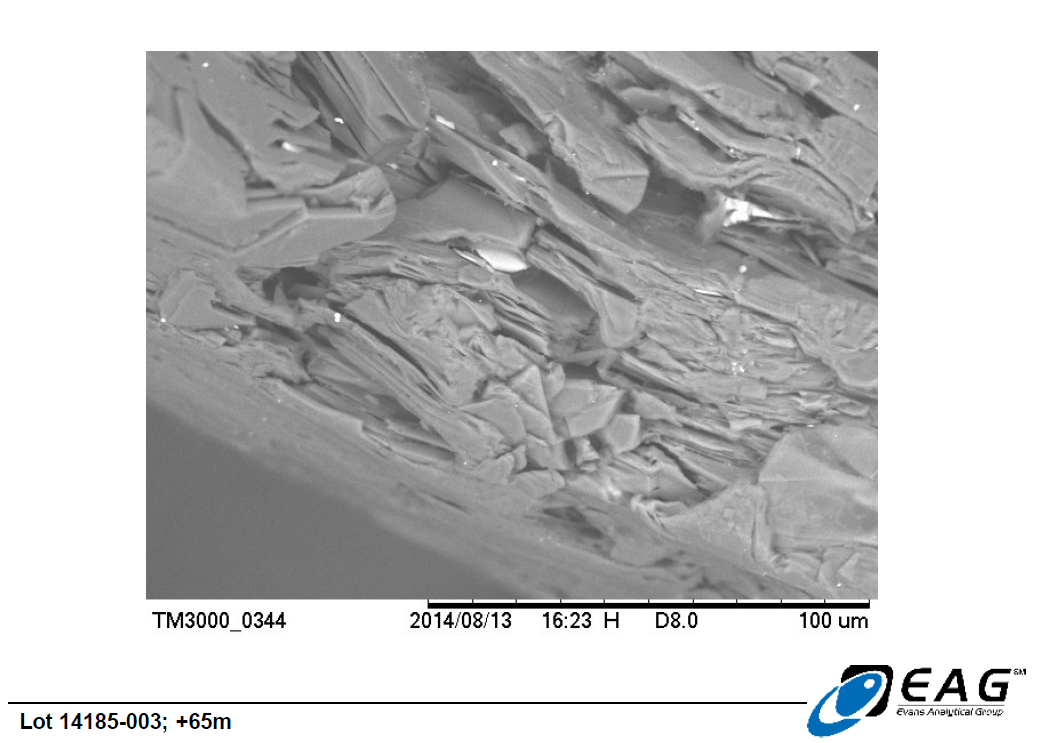
Magnified view (1100 X) of crystal edge domain, showing more extensive mechanical disruption, and matrix intercalation.
Bench scale flotation-optimization work has yielded graphite concentrates at up to 100% C(t) by Leco furnace method; (please see press release dated June 4, 2014 at https://www.canadacarbon.com/newsdetail?&newsfile=ccb_20140604.htm).Prior laboratory characterization and upgrading investigations have shown that the Miller graphite can be easily upgraded by both hydrometallurgical processing and thermal upgrading techniques, either applied alone, or in combination. On October 15, 2013, the Company reported that hydrometallurgical treatment of the graphite flotation concentrate yielded 99.965% C(t) (GD-MS method, calculated by difference), which met the nuclear purity standard for Equivalent Boron Content (EBC). (https://www.canadacarbon.com/newsdetail?&newsfile=ccb_20131015.htm). When hydrometallurgical upgrading was combined with thermal upgrading, a sample yielded 99.9978% C(t). https://www.canadacarbon.com/newsdetail?&newsfile=ccb_20131212.htm Rapid thermal upgrading, applied to an otherwise untreated flotation concentrate, yielded a graphite grade of 99.98% C(t). https://www.canadacarbon.com/newsdetail?&newsfile=ccb_20140617.htm
Based on the observed behaviour of the Miller graphite, the Company's technical advisors and research associates have developed a working hypothesis that the siliceous hydrothermal matrix associated with the graphite crystals being examined herein is not extensively intercalated (intergrown) within the graphite crystal structure. Instead, the hydrothermal matrix is believed to primarily be found on the surfaces of the graphite grains, where it would be fully exposed to the effects of hydrometallurgical or thermal upgrading processes. The SEM images reported here are not inconsistent with that hypothesis.
These SEM images, as well as those reported on April 29, 2014 (https://www.canadacarbon.com/newsdetail?&newsfile=ccb_20140429.htm), clearly reveal the gross morphology of the Miller graphite particles (very large, platy, graphite crystals), as well as the well-organized microstructure of those crystals (parallel layering, with very limited porosity/void space; please refer to the accompanying technical review of the Miller graphite’s BET surface area and porosity analysis, for further evidence).
For illustrative and comparative purposes, the following SEM images derived from samples of synthetic and natural (flake) graphite are provided. The samples were being studied as part of a research program associated with the design and development of the graphite-moderated nuclear reactors commonly known as pebble-bed reactors. The selected images are of singular examples of synthetic and natural flake graphite, and should not be interpreted as being generalizable to other products within those categories. The images were published within a doctoral thesis, written by Heinrich Badenhorst, of the University of Pretoria, South Africa, which is available athttp://upetd.up.ac.za/thesis/available/etd-04172012-190006/unrestricted/00front.pdf, and are identified here as they appear in that document.
Flake Graphite:
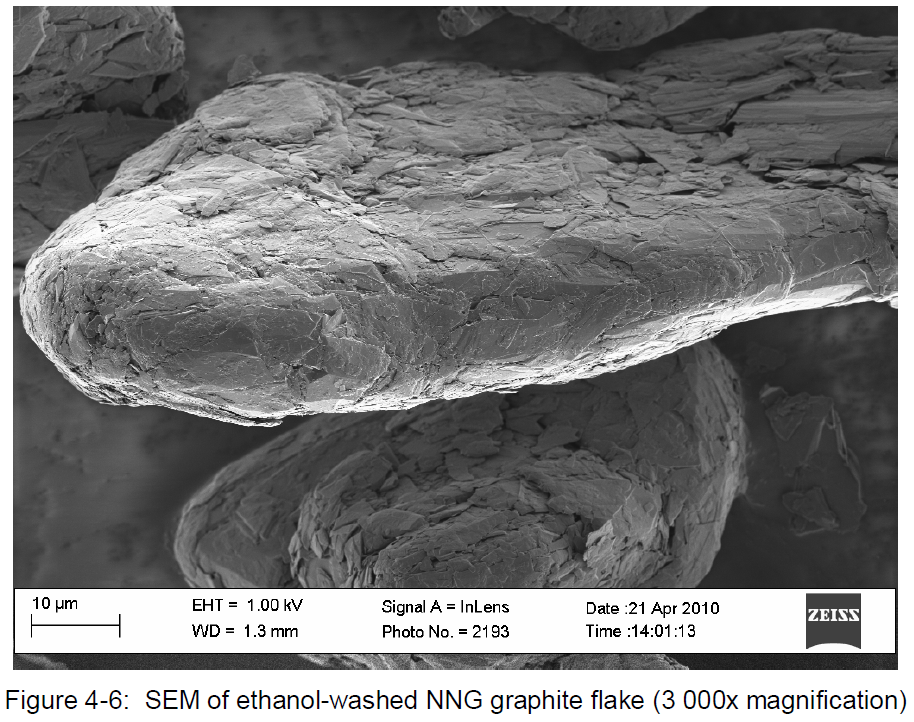
Milled surface of flake graphite particle, described by Badenhorst as being "an agglomerate of very fine particles".
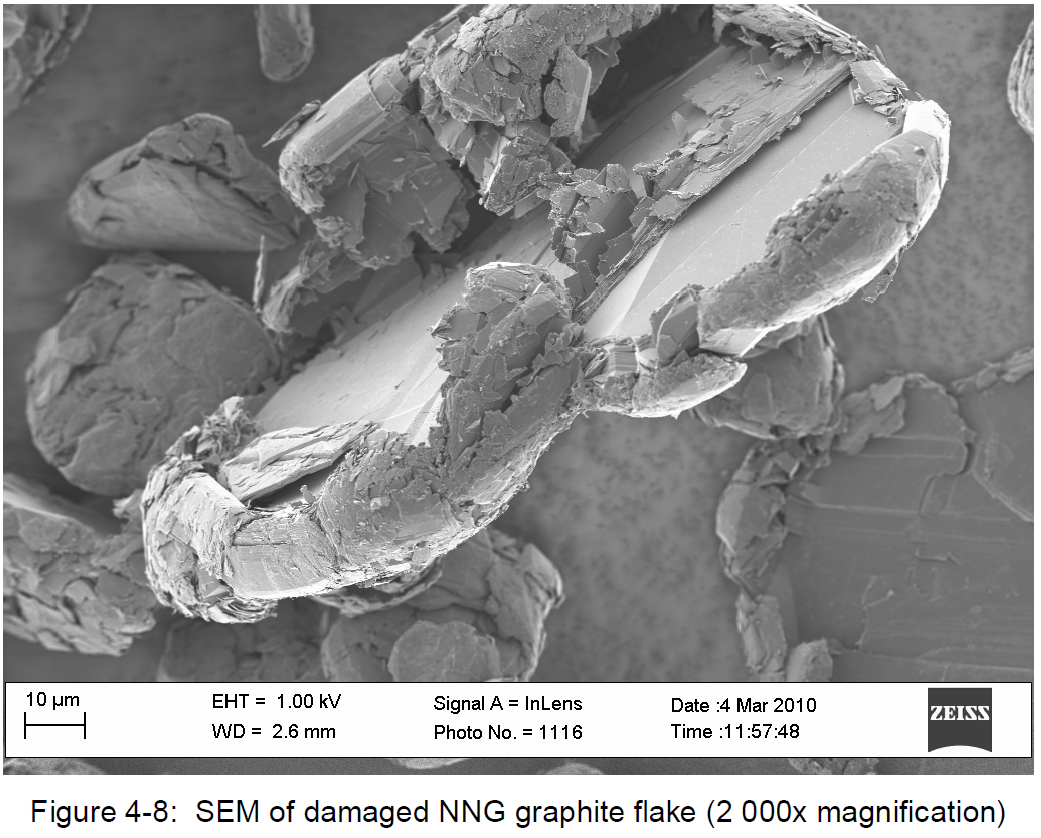
Close-up of mechanical damage to flake graphite particle.
Synthetic Graphite:
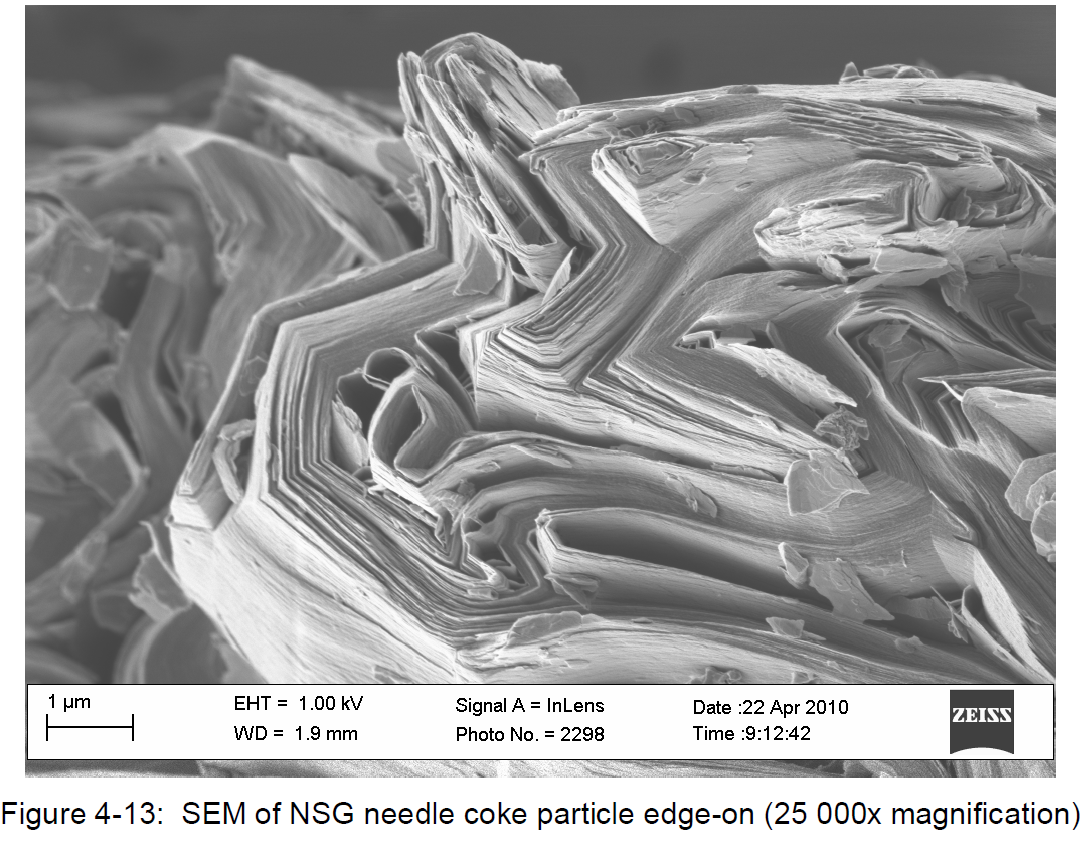
Close-up of graphitized coke domain within synthetic graphite particle, showing random orientation of graphite crystals, and obvious void spaces.
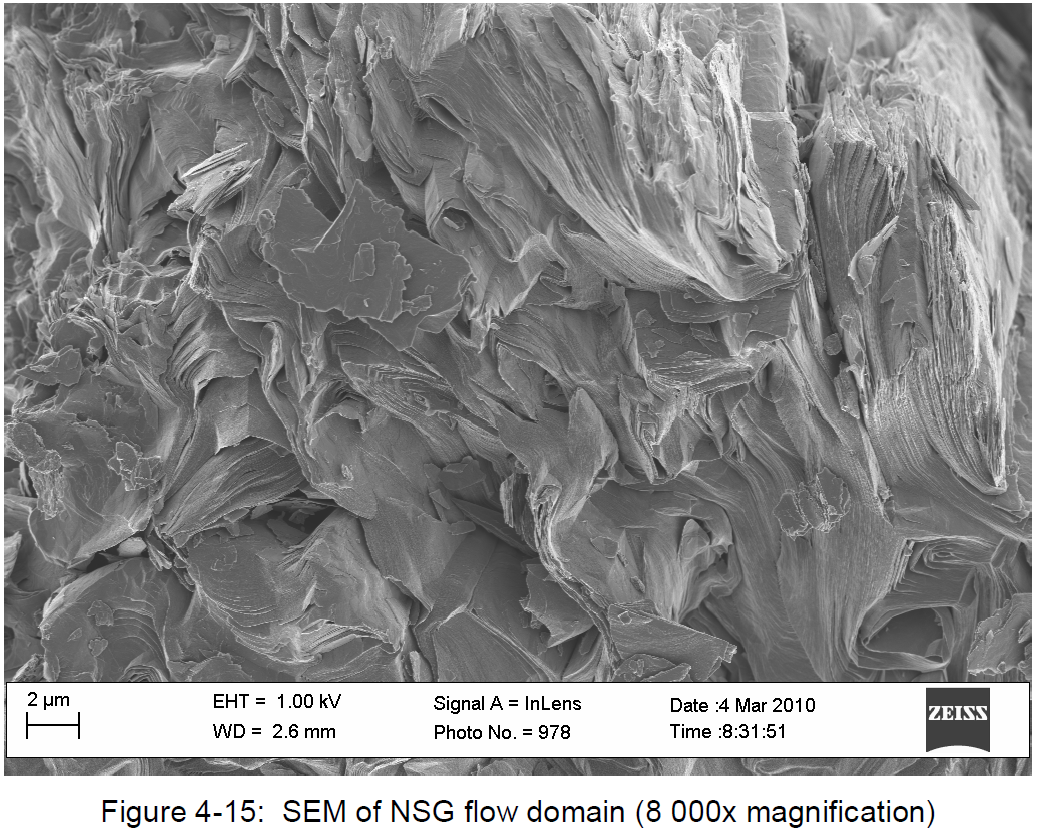
Close-up of graphitized resin binder domain within synthetic graphite particle, showing completely random graphitization.
Badenhorst provides a full interpretation of these images in Chapter 4 of his thesis.
Laboratory Procedures and Facilities
Graphite purity assays were conducted by SGS Canada Inc., Lakefield ON, as a routine part of the bench-scale flotation optimization trial, as previously reported. All reported analytical results have an associated measurement uncertainty based on the expected precision and accuracy relating to the method and sample concentration. Values at 100% should not be treated as pure products without additional impurity testing. The chemical analysis used to determine the total carbon content employs combustion of a sample followed by infrared detection on a LECO SC-632 instrument. The estimated measurement uncertainty for total carbon values greater than 50% C(t) is 1.4% (relative) with a resolution of 1 significant figure. For example, a reported assay value of 99.0% C(t) could therefore range between 97.6% and 100% C(t).
Scanning electron micrographs (SEM images) were provided by Evans Analytical Group, Liverpool NY. The SEM images were collected on a Hitachi TM3000 Tabletop SEM. The BSE spectra were analyzed using a Bruker Quantax 70 SDD system.
References:
Badenhorst, Heinrich. (2011). "Modelling the mechanisms that govern the oxidation of graphite." Doctoral thesis (Chemical Engineering), University of Pretoria, South Africa. http://upetd.up.ac.za/thesis/available/etd-04172012-190006/unrestricted/00front.pdf